July Jobs Upside Blowout Signals More Rate Hikes
But jobs prints are largely in lower-wage and government supported jobs; participation rate remains dismalCommentary NEW YORK—July jobs printed at a blowout 528,000 jobs, more than double the consensus estimate of 250,000 jobs. The unemployment rate was 3.5 percent, down 0.1 percentage point from last month, and also down from last July’s 5.4 percent. The labor force participation rate was 62.1 percent, up from the 61.7 percent that printed in July 2021, but down 10 basis points (bps, defined as 1/100th of a percentage point) from June. May and June revisions combined to create 28,000 more jobs than previously reported. We are largely at the same level of jobs that we had prior to the CCP (Chinese Communist Party) virus, but the jobs creation that would have occurred in that period is lost, likely permanently. The majority of jobs were in lower-wage sectors, like Leisure and hospitality, and sectors that are largely government supported, like Education and health services. That said, Professional & business services, a higher wage sector, also showed strong jobs performance at 89,000 jobs with an average weekly wage of over $1,400. July Jobs by Average Weekly Wages. (BLS Data/Stuyvesant Square Consultancy) Annualized average real wages, which we report on a quarterly basis, increased by nearly $173. However, annualized real wages fell among manufacturing, trade, transportation, utilities, and retail, which was largely predictable because of the record level of business inventories. Annualized real wages also fell among Financial and Leisure and hospitality workers. Other Data The Federal Reserve balance sheet is shrinking, but too slowly in our view. The Federal Reserve (“Fed”) is allowing a “burn-off” (i.e., allowing to mature without repurchasing) of its portfolio of Treasury securities and mortgage-backed securities up to a maximum of $47.5 billion per month. (In September, the cap on the burn-off will be increased to $95 billion per month.) The continuing and deepening of the yield curve inversion, where short-term interest rates are higher than longer-term rates, would not be happening if the Fed was reducing its balance sheet much more rapidly, as we have desired since last year. Right now, the 2 Year/10 Year yield curve is inverted at its deepest rate in 22 years and has been inverted for a month. The Institute for Supply Management’s print of the Manufacturers Purchasing Managers’ Index, the Manufacturing PMI,® registered growth in July at 52.8 percent down -0.2 percentage points from June (pdf). The Institute’s Services PMI® showed growth at 56.7 percent, up 1.4 percentage points from June. A reading above 50 signals growth. The Job Openings and Labor Turnover Survey (JOLTS) showed the number and rate of job openings decreased to 10.7 million (-605,000) and 6.6 percent, respectively in June, the latest available data. We anxiously anticipate the release Monday of second quarter (2022Q2) Labor Productivity and Costs. As we noted in the June jobs report, the 2022 Q1 labor productivity (pdf), dropped to the lowest level since 1947. As a consequence, unit labor costs increased 12.6 percent, thus adding to our inflation. We’re hopeful that the first print of 2022Q2 data will show improvement. Household debt service as a percentage of disposable personal income keeps rising, particularly consumer debt. This is to be expected in an inflationary economy when wages fail to keep pace with higher prices and workers turn to their credit cards and consumer loans to maintain their lifestyle. Total business inventories are ridiculously high and the highest on record. Housing starts in June, released July 19th, were at a seasonally adjusted annual rate of 1,559,000. This is 2.0 percent below the revised May estimate of 1,591,000 and 6.3 percent below the June 2021 rate of 1,664,000. The IBD/TIPP Index of Economic Optimism for July was largely unchanged, up just 1 percent, to 38.5. (The index signals optimism at 50 or above.) Commentary The Atlanta Fed is projecting 2022Q3 to print at about 1.5 percent growth. The two quarters of decline in 2022Q1 and Q2 printed at a technical recession, which will need to be confirmed by the National Bureau of Economic Research Business Cycle Dating Committee, likely after the second revision of the data on Sept. 29th. However, we reiterate our thesis that much of the 2022Q1 and 2022Q2 negative GDP was attributable to an anomaly with imports and inventories, as we explained in more detail in our 2022Q2 GDP report. Inflation continues to print at an unacceptable level. We expect a sight decrease of between 50 to 100 bps in the annualized inflation print next Wednesday, mostly as a consequence of falling gasoline and crude prices as those affect prices throughout the economy. It would be helpful if the Fed were to increase the limit of the Treasurys and Mortgage Back Securities (MBS) that it allows to “burn off” to at least $125 billion at its nex
But jobs prints are largely in lower-wage and government supported jobs; participation rate remains dismal
Commentary
NEW YORK—July jobs printed at a blowout 528,000 jobs, more than double the consensus estimate of 250,000 jobs. The unemployment rate was 3.5 percent, down 0.1 percentage point from last month, and also down from last July’s 5.4 percent. The labor force participation rate was 62.1 percent, up from the 61.7 percent that printed in July 2021, but down 10 basis points (bps, defined as 1/100th of a percentage point) from June. May and June revisions combined to create 28,000 more jobs than previously reported.
We are largely at the same level of jobs that we had prior to the CCP (Chinese Communist Party) virus, but the jobs creation that would have occurred in that period is lost, likely permanently.
The majority of jobs were in lower-wage sectors, like Leisure and hospitality, and sectors that are largely government supported, like Education and health services. That said, Professional & business services, a higher wage sector, also showed strong jobs performance at 89,000 jobs with an average weekly wage of over $1,400.
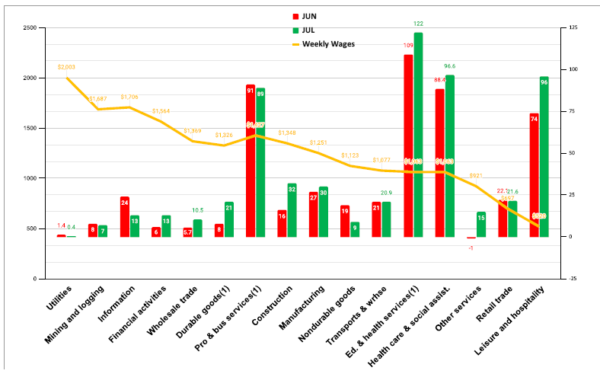
Annualized average real wages, which we report on a quarterly basis, increased by nearly $173. However, annualized real wages fell among manufacturing, trade, transportation, utilities, and retail, which was largely predictable because of the record level of business inventories. Annualized real wages also fell among Financial and Leisure and hospitality workers.
Other Data
The Federal Reserve balance sheet is shrinking, but too slowly in our view. The Federal Reserve (“Fed”) is allowing a “burn-off” (i.e., allowing to mature without repurchasing) of its portfolio of Treasury securities and mortgage-backed securities up to a maximum of $47.5 billion per month. (In September, the cap on the burn-off will be increased to $95 billion per month.) The continuing and deepening of the yield curve inversion, where short-term interest rates are higher than longer-term rates, would not be happening if the Fed was reducing its balance sheet much more rapidly, as we have desired since last year. Right now, the 2 Year/10 Year yield curve is inverted at its deepest rate in 22 years and has been inverted for a month.
The Institute for Supply Management’s print of the Manufacturers Purchasing Managers’ Index, the Manufacturing PMI,® registered growth in July at 52.8 percent down -0.2 percentage points from June (pdf). The Institute’s Services PMI® showed growth at 56.7 percent, up 1.4 percentage points from June. A reading above 50 signals growth.
The Job Openings and Labor Turnover Survey (JOLTS) showed the number and rate of job openings decreased to 10.7 million (-605,000) and 6.6 percent, respectively in June, the latest available data.
We anxiously anticipate the release Monday of second quarter (2022Q2) Labor Productivity and Costs. As we noted in the June jobs report, the 2022 Q1 labor productivity (pdf), dropped to the lowest level since 1947. As a consequence, unit labor costs increased 12.6 percent, thus adding to our inflation. We’re hopeful that the first print of 2022Q2 data will show improvement.
Household debt service as a percentage of disposable personal income keeps rising, particularly consumer debt. This is to be expected in an inflationary economy when wages fail to keep pace with higher prices and workers turn to their credit cards and consumer loans to maintain their lifestyle.
Total business inventories are ridiculously high and the highest on record.
Housing starts in June, released July 19th, were at a seasonally adjusted annual rate of 1,559,000. This is 2.0 percent below the revised May estimate of 1,591,000 and 6.3 percent below the June 2021 rate of 1,664,000.
The IBD/TIPP Index of Economic Optimism for July was largely unchanged, up just 1 percent, to 38.5. (The index signals optimism at 50 or above.)
Commentary
The Atlanta Fed is projecting 2022Q3 to print at about 1.5 percent growth. The two quarters of decline in 2022Q1 and Q2 printed at a technical recession, which will need to be confirmed by the National Bureau of Economic Research Business Cycle Dating Committee, likely after the second revision of the data on Sept. 29th. However, we reiterate our thesis that much of the 2022Q1 and 2022Q2 negative GDP was attributable to an anomaly with imports and inventories, as we explained in more detail in our 2022Q2 GDP report.
Inflation continues to print at an unacceptable level. We expect a sight decrease of between 50 to 100 bps in the annualized inflation print next Wednesday, mostly as a consequence of falling gasoline and crude prices as those affect prices throughout the economy.
It would be helpful if the Fed were to increase the limit of the Treasurys and Mortgage Back Securities (MBS) that it allows to “burn off” to at least $125 billion at its next meeting in September to reduce the Fed’s balance sheet more rapidly. We think investment professionals are a bit sanguine that the Fed will loosen its tightening of rates. Real overnight rates will need to go to 3.5 to 5 percent, and stay there for at least three quarters, to thoroughly extinguish inflation and, more importantly, inflationary expectations.
The tax bill currently being discussed is troubling because the minimum tax provisions will likely offset investment decisions necessary for an increase in our now record-low productivity. As we explained at some length in our April jobs report, here, prices are a function of the money supply and the quantity of goods (MV=PQ). As the Fed reduces the money supply (M) with quantitative tightening in monetary policy, Capitol Hill and the president would err gravely with fiscal policy that discourage capital investment that further reduces labor productivity and, thus, the quantity of goods and services (Q) in the economy. The two policies would operate at cross-purposes, creating a policy contretemps between the Fed and the Democrats’ stated intent to fight inflation.
We believe 2022Q3 GDP will print in the neighborhood of 1 to 1.5 percent. We are monitoring gray swans in the Taiwan Straits, Ukraine, and Europe and post information on those in our Twitter feed, @Stuysquare.
DISCLOSURE: The views expressed, including the outcome of future events, are the opinions of The Stuyvesant Square Consultancy and its management only as of August 5, 2022, and will not be revised for events after this document is submitted to The Epoch Times editors for publication. Statements herein do not represent, and should not be considered to be, investment advice. You should not use this article for that purpose. This article includes forward looking statements as to future events that may or may not develop as the writer opines. Before making any investment decision you should consult your own investment, business, legal, tax, and financial advisers. We associate with principals of TechnoMetrica on survey work in some elements of our business.
Note: Our commentaries most often tend to be event-driven. They are mostly written from a public policy, economic, or political/geopolitical perspective. Some are written from a management consulting perspective for companies that we believe to be under-performing and include strategies that we would recommend were the companies our clients.
Views expressed in this article are the opinions of the author and do not necessarily reflect the views of The Epoch Times.